If you're new here, you may want to subscribe to my RSS feed. Thanks for visiting!
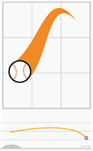
Lokesh Dhakar has illustrated a series of diagrams showing the trajectories of variously-pitched baseballs.
The illustrations are simple and clean, and yet still communicate a large amount of information - movement in three dimensions, ball orientation at pitch point, and speed. (Note the color gradients from yellow to red to indicate different speeds.)
No? Well, it has something to do with a bunch of baseball players whose initials don’t match their names. There’s also some “periods” (which are called “Yr”). We don’t need no stinkin’ Y-axis, because it’s clear that periods are plotted against… uh, “money?” It also looks like someone needed a title, shook a magic 8-ball, and “Prospect Value Analysis” floated into the transparent window.
I’d go on, but the real fun is in reading the comments.
As you may have surmised by now, theMonkey is a rather large fan of tOSU football Buckeyes. Therefore, it was a great honor to be approached by my friend, el Kaiser, and invited to be a regular writer for his new sports blog.
I present to you: Men of the Scarlet and Gray.
MotSaG is an Ohio-themed sports site, and will feature articles and information on amateur and professional athletic sports that occur anywhere from “toward the Lake” (Erie - north) to “toward the River” (the Ohio - south).
Much of the content will be tOSU-centric, hence the blog’s name. “Men of the Scarlet and Gray” is a line from the legendary Buckeye Battle Cry, the most famous and renowned fight song in Division I-A football.
So… if you:
know what a real buckeye is, and have a recipe for candy ones
think all professional football teams should wear orange
subscribe to a newspaper that covers national/international news on one page while devoting twelve pages to sports
can pronounce “Olentangy,” “Bellefontaine,” “Cuyahoga,” and “Tuscarawas”
know what should be “knee-high by July”
understand the following sentence: “Ha-ha, ol’ Sweater Vest is 4-1 against four-loss-Lloyd”
know that the best brats are boiled in beer until 75% done, then finished over an open flame
are interested in any sports that take place in cities or communities close to I-71 and/or State Route 3…
then stop on over to MotSaG. My moniker over there is (what else?)sportsMonkey.
In the meantime, enjoy this video of the best player in college football, and allow yourself to get excited about the ’06 season.
Late summer 1985, and I’ve been told to get to bed. I’m just beginning the seventh grade, and Mom and Dad are enforcing the bedtime rules. Lying in bed, I struggle to fall asleep, even though the room isn’t quite dark yet. I can hear the sounds of a late summer night though my open bedroom window: a dog barking; an occasional car whooshing down the street, temporarily drowning out the mad cacophony of frogs and insects; the neighbor’s sprinkler swishing in his front yard, striking our aluminum siding every 43 seconds.
I hear Daddy’s footsteps pounding up the stairs. He opens the door gently, and pokes his head in. I’m pretending to be asleep. “Psst. Hey. Get up. He’s about to do it,� he whispers. Continue reading ‘A quiet game’
About the monkey
An escapee from a government contractor’s test lab, the monkey lives in hiding, hacking away at the keyboard to bring you random thoughts, stories, news, and graphics. Depending on his mood, he may be informative, amusing, obnoxious, or inane.
 Lokesh Dhakar has illustrated a series of diagrams showing the trajectories of variously-pitched baseballs.
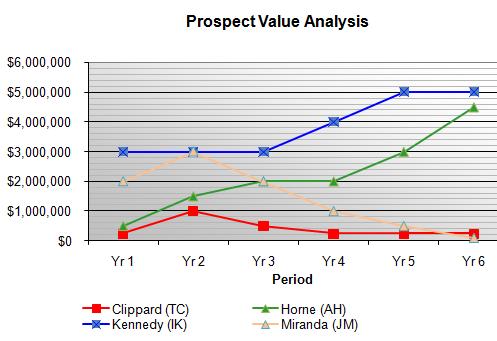

 < - Home